
KNIME Analytics Platform
Introduction
I had a fantastic opportunity in summer 2019 to do an internship at the University of Reading, Department of Computer Science, under the tutelage of the Pr. Giuseppe Di Fatta, data analytics & mining teacher. We worked on a contributive data analytics software which is named Knime Analytics Platform; it provides a system of "nodes" (little algorithms) that users could link together to create a workflow. Knime Analytics Platform is basically a plugin for Eclipse, and those nodes are themselves plugins for it. So my job was to conceive and develop in Java new nodes for this platform, and essentially about the k-means algorithm, which is a famous clustering one.

KNIME Analytics Platform logo
Mission
K-means is a clustering algorithm; it means that for a given dataset, the user gives to the algorithm the number k of clusters he wants, it will try to optimize the position of k means-points (or centroids), and it will associate each data point with a mean-point (creating a cluster) using distances and means to determine which one is the best for this data point. This kind of algorithm already existed on KNIME, but the Pr. Di Fatta and I tried to develop a "multiple k-means". The purpose was not anymore to apply directly the k-means algorithm but to find in a range of value the most likely to be an optimal number of clusters for a given dataset. The user enters in parameter his dataset, the minimal number of clusters he wants, and the maximal number of clusters. Our node had to be able to compare the different clustering versions for each k in this range and return which one is most likely to be the best.
There are different manners to resolve this problem, and they are essentially visual ones. The most famous is the Elbow method: the most likely to be an optimal number of clusters is recognizable on a graphic representation of the percentage of variance explained (proportion to which a mathematical model accounts for the variation of the given data set) by the number of clusters with an "elbow" on the curve. It means that the percentage of variance explained will grow with the augmentation of the number of clusters k, but there will be a certain value of k for which the increase of the percentage of variance explained will drop, and the subsequent improvements will be less significant. This value of k is considered to be the most likely to be an optimal number of clusters for the given dataset.
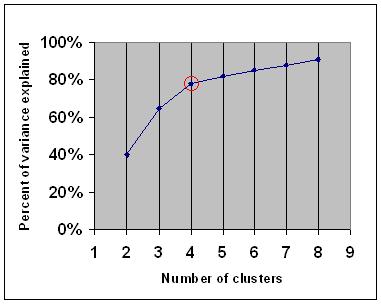
Explained variance. The "elbow" is indicated by the red circle (Wikipedia)
My mission was to create a KNIME node that will be able to use this Elbow Method and determine the most likely to be an optimal number of clusters; as it is essentially a visual and graphical one, I choose to use vectors and angles to try to determine the "elbow". With trigonometry properties, I computed the values of the angles and assumed after some tests that the minimal one Amin for y number of clusters will be the "elbow". To potentially accelerate the algorithm, we added an ε criterion to verify if there could be another angle Amin' in [Amin - ε, Amin + ε] for y' number of clusters (with y' < y) because a smaller number of clusters leads to faster computation.
Here is the paper I wrote with the Pr. Di Fatta about our variable k-means node: